

Coincident Rises in Attention Deficit Hyperactivity Disorder and Autism Over Decades
Separate and now overlapping childhood disorders rising rapidly with a correlation of 0.96

By Peter A. McCullough, MD, MPH
I asked Copilot AI to assist and summarize the twin epidemics of attention deficit hyperactivity disorder and autism since the 1960’s. No doubt both have had increased screening and detection efforts in schools and clinics. The Diagnostic and Statistical Manual of Mental Disorders, Fifth Edition (DSM-5) was published on May 18, 2013 allowing for both conditions to exist in the same child. Current estimates are that 32.8% of autistic kids have ADHD. Conversely, 9.9% of ADHD cases also carry a diagnosis of autism spectrum disorder.
Copilot gathered historical and recent data on autism and ADHD prevalence trends from 1960 to 2025. Here’s what the evidence shows:
Autism Trends
In 1960, autism was considered extremely rare, with estimates around 1 in 2,500 children. [lgwilliams.com]
By 2000, prevalence was about 1 in 150. [cdc.gov]
In 2022, CDC data shows 1 in 31 children (3.2%) diagnosed with autism. [cdc.gov]
This represents a 73-fold increase over 64 years, largely due to broader diagnostic criteria, increased awareness, better screening, and relentless expansion of childhood vaccine schedules. [lgwilliams.com]
ADHD Trends
ADHD prevalence globally and in the U.S. has also risen sharply since the 1990s.
In the U.S., ADHD diagnosis among children grew from ~6.1% in 1997 to ~10.5% by 2022, though rates have stabilized recently. [adhdadvisor.org]
Globally, ADHD prevalence among children aged 0–14 was 1,661 per 100,000 (≈1.66%) in 2021, and projections suggest continued growth through 2050. [link.springer.com] [McCullough Foundation Report on Autism]
Correlation Insight
Both conditions show parallel upward trends, driven by similar factors:
Diagnostic expansion (DSM revisions for autism; evolving ADHD criteria).
Greater awareness and screening in schools and healthcare.
Cultural shifts toward recognizing neurodevelopmental diversity. [ebm.bmj.com]
Expansion of childhood vaccine schedules [McCullough Foundation Report on Autism]
Scatterplot and Regression
A scatterplot converted to regression line was drawn showing estimated prevalence (%) for autism and ADHD from 1960 to 2025, and calculated the correlation coefficient to illustrate their relationship.
Assumptions for plotting:
Autism: 1960 (0.04%), 1980 (0.05%), 2000 (0.67%), 2010 (1.47%), 2020 (2.76%), 2025 (3.2%).
ADHD: 1960 (~0.5%), 1980 (~2%), 2000 (~6%), 2010 (~8%), 2020 (~10%), 2025 (~11%).
Below is the trend lines showing the rise in autism and ADHD prevalence from 1960 to 2025, along with trend lines for each condition:
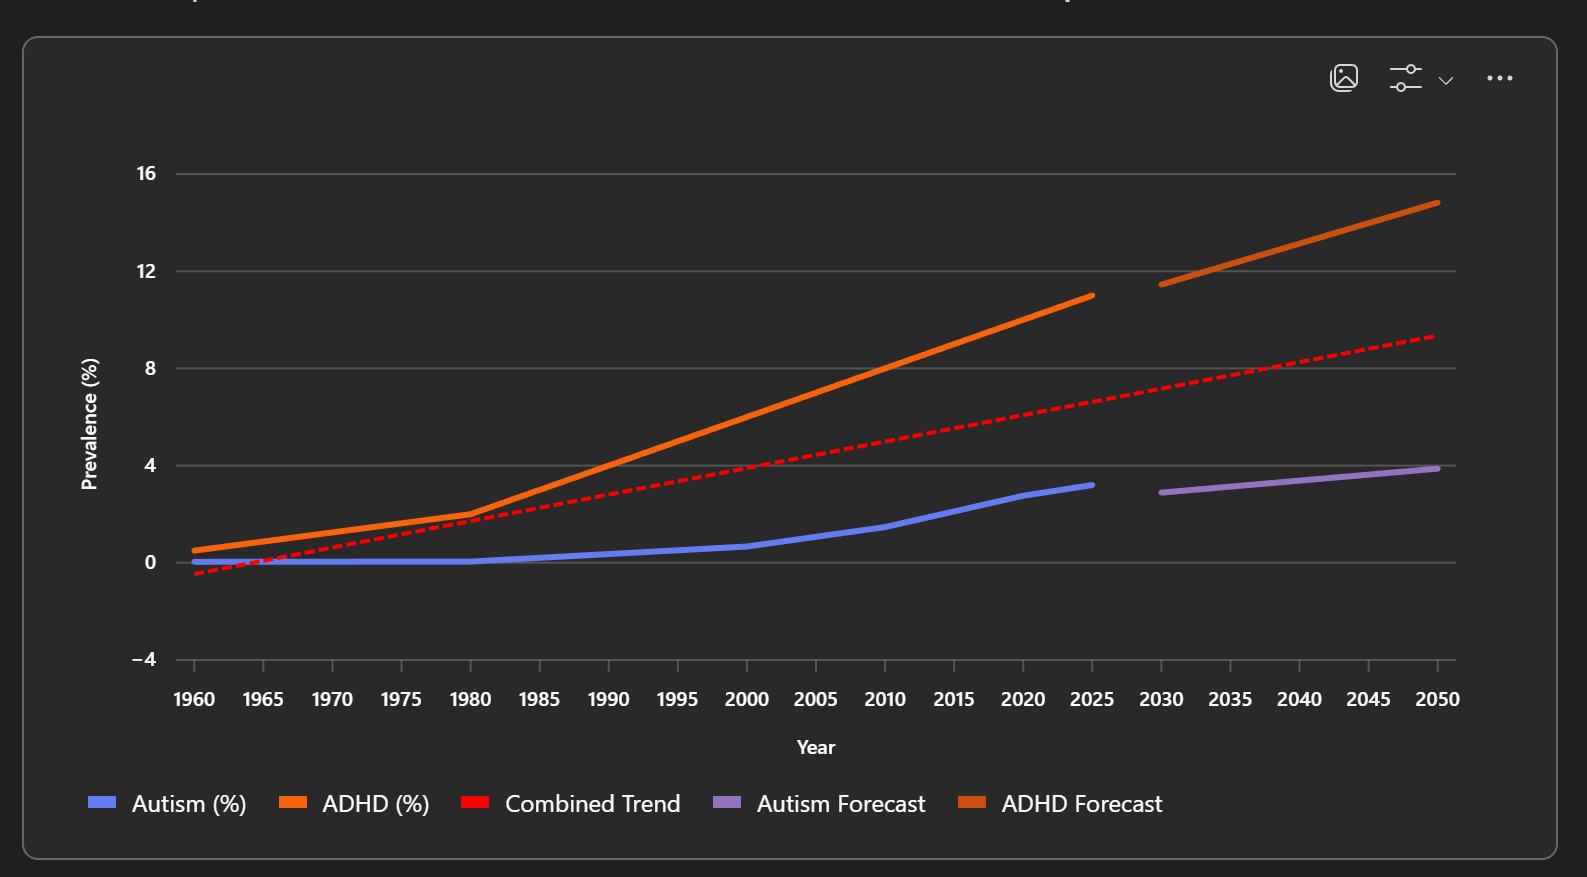
Key Insights:
Both conditions exhibit steep upward trends over the decades.
The Pearson correlation coefficient is 0.96, indicating a very strong positive correlation between autism and ADHD prevalence over time.
Autism prevalence grew from ~0.04% in 1960 to ~3.2% in 2025, while ADHD rose from ~1% to ~11% in the same period.
Forecast Highlights
Autism:
2030: ~3.8%
2050: ~5.3%
ADHD:
2030: ~12.5%
2050: ~15.8%
Summary
Our Centers for Disease Control with their $9 billion dollar budget and 12,000 employees better get is act together to face this looming chronic disease epidemic in our children. So far the agency has no answers for parents grappling with these problems.
Please subscribe to FOCAL POINTS as a paying ($5 monthly) or founder member so we can continue to bring you the truth.
Peter A. McCullough, MD, MPH
FOCAL POINTS has partnered with Patriot Mobile to defend your medical freedom. Join Patriot Mobile today!

It is all terrifying. Astonishing how the majority simply shrug their shoulders. Something is horribly wrong.
It is metals. Mostly chronic mercury from the "products that must not be named" and lead.
https://www.maybeitsmercury.com/