


By Peter A. McCullough, MD, MPH
Throughout the pandemic I have greatly respected the work of Canadian quantitative scientist Dr Denis Rancourt from Ottawa. Finally, I landed him on Focal Points after we had lunch at the Allison Inquiry in Canada’s Parliament.
🎙️ Focal Points: McCullough Interviews Denis Rancourt
Dr. Peter McCullough hosts interdisciplinary scientist Dr. Denis Rancourt — a physicist by training who worked across biogeochemistry, measurement methods, soil science, and marine sediment nutrient cycles — for a wide-ranging discussion centered on his testimony at the Canadian Allison Inquiry on Parliament Hill, Ottawa, Canada.
🔬 Background: The Career Rebel
Trained as a physicist, but worked across multiple faculties; taught a unique graduate course on diffraction, spectroscopy, and microscopy methods
His most-cited papers cover the theory of spectroscopy, soil science and nutrient evolution, and marine/lake sediment nutrient cycles
Dismissed from academia in 2009 over an academic-freedom dispute; his union fought for roughly a decade to reach a settlement. The dismissal was covered nationally in Canada and twice in the New York Times
Says this history gave him a “nose for lies and constructed narratives” — he describes himself as easily able to recognize propaganda and be critical of institutions
Turned to COVID analysis in 2020; published a June 2, 2020 paper arguing mortality peaks had to stem from mistreatment in homes and hospitals, not the virus itself
Works with Correlation-Canada.org, alongside Marine Baudin (France), Jeremy Mercier, and physicist Joseph Hickey — roughly 30 large reports on mortality to date

🗂️ Data Foundations
Rancourt’s approach deliberately ignores assigned cause of death and works only from hard all-cause mortality counts:
CDC Wonder and Statistics Canada provide death counts, ages, sexes, and jurisdictions — solid, even if death certificates are flawed
COVID “scoreboards” were not death-certificate data — they were test-positive-plus-death feeds, a convention in infectious disease epidemiology (only ~15% of influenza-positive deaths are adjudicated as due to influenza pneumonia)
Rancourt’s key premise: whatever the assigned cause, the timing and scale of death spikes is the signal
📈 Part One: The Mortality Signals
🤰 Maternal Mortality (US)
CDC issued an advisory on August 11, 2021 directing vaccination of pregnant women in any trimester — shown as the red dashed line on the slide
In “poor states” (12%+ poverty threshold), maternal mortality shot up immediately after that date — a roughly threefold increase on a per-live-birth basis
A second peak coincided with the additional-dose and booster rollout
Rancourt: “In my humble opinion, that cannot be a coincidence”
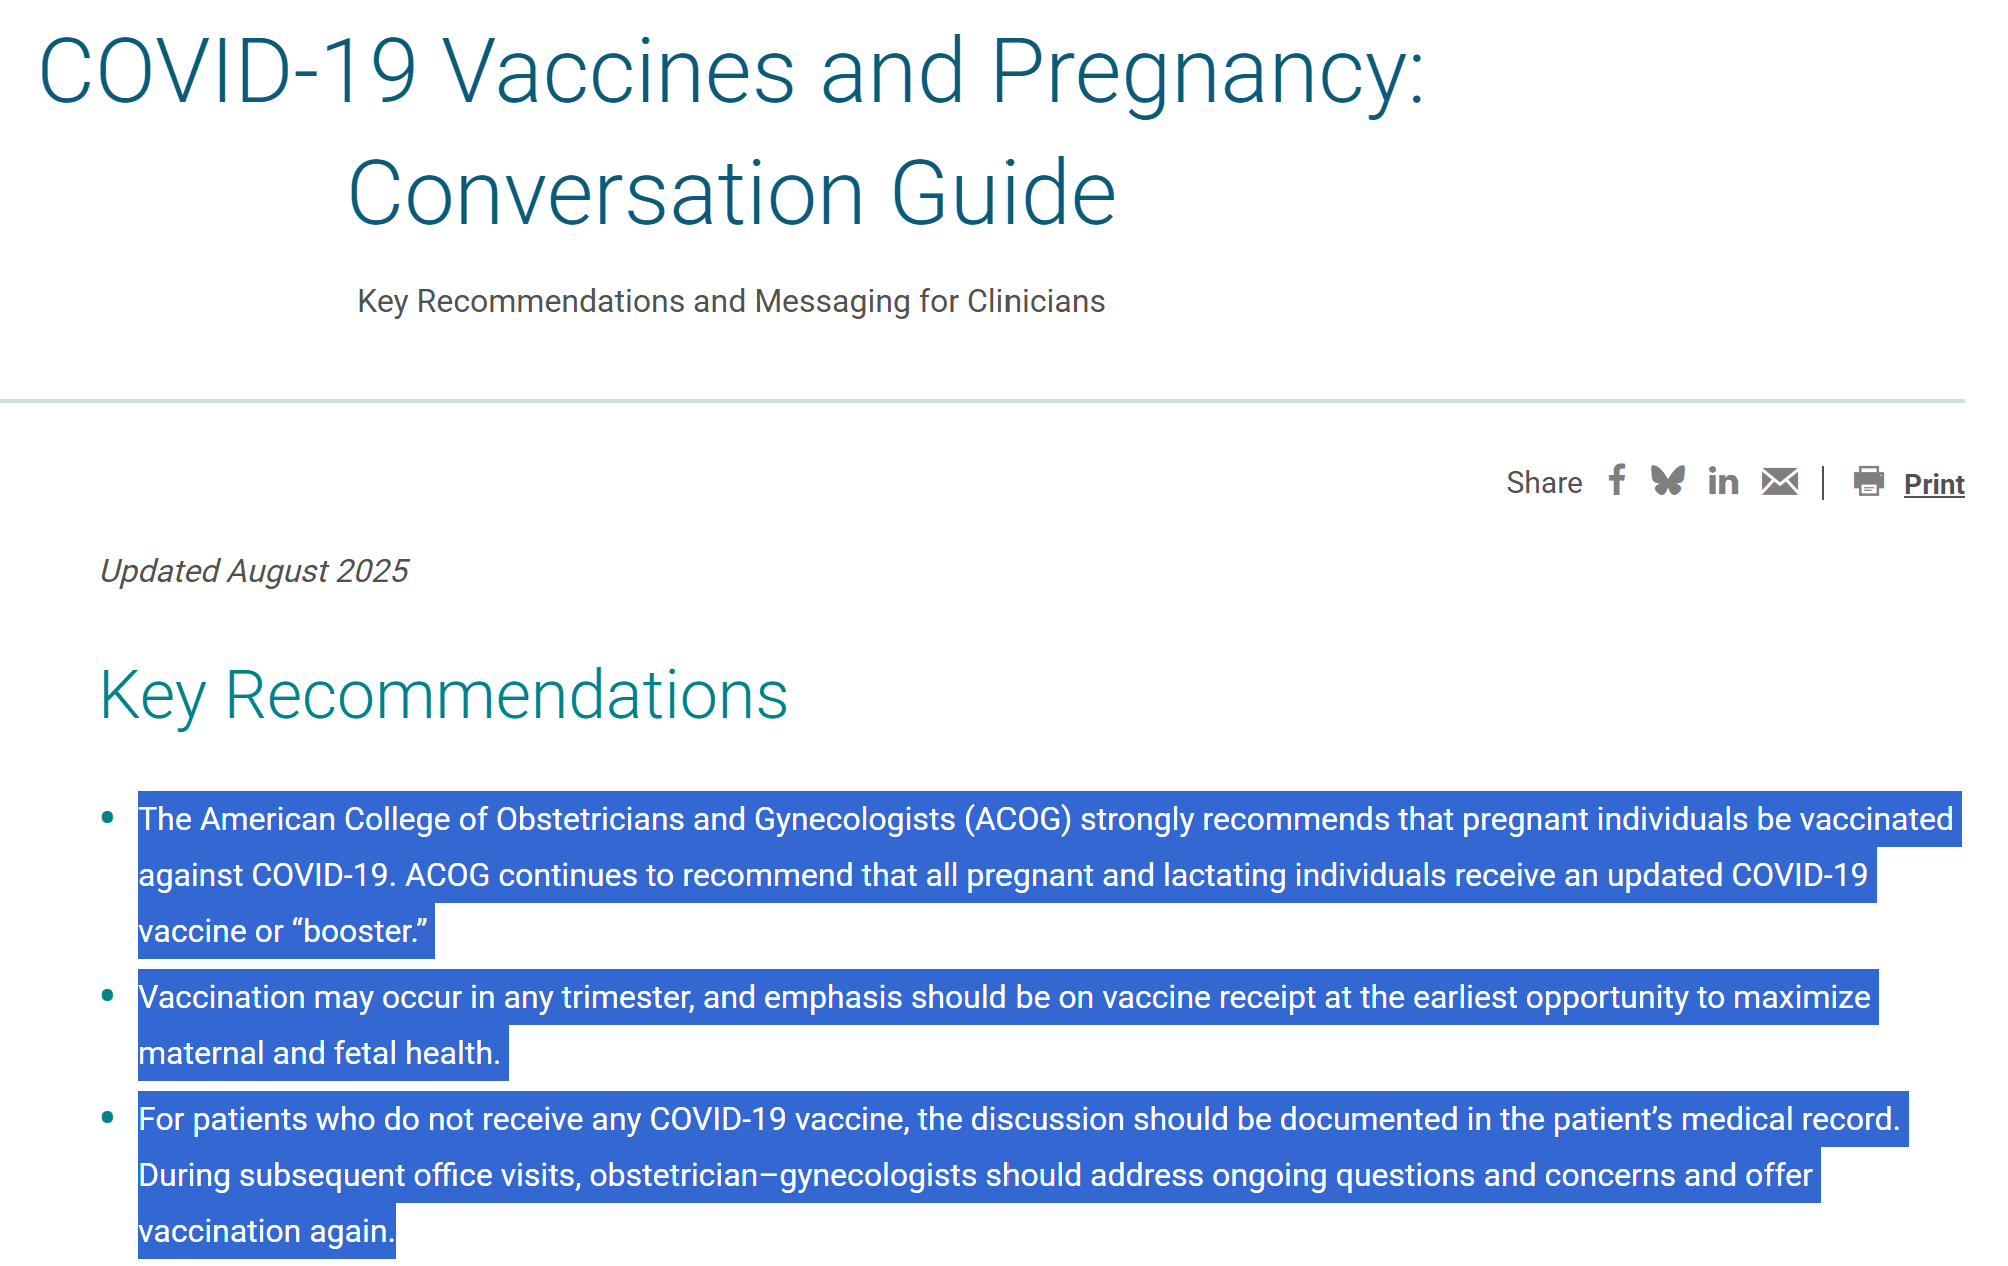
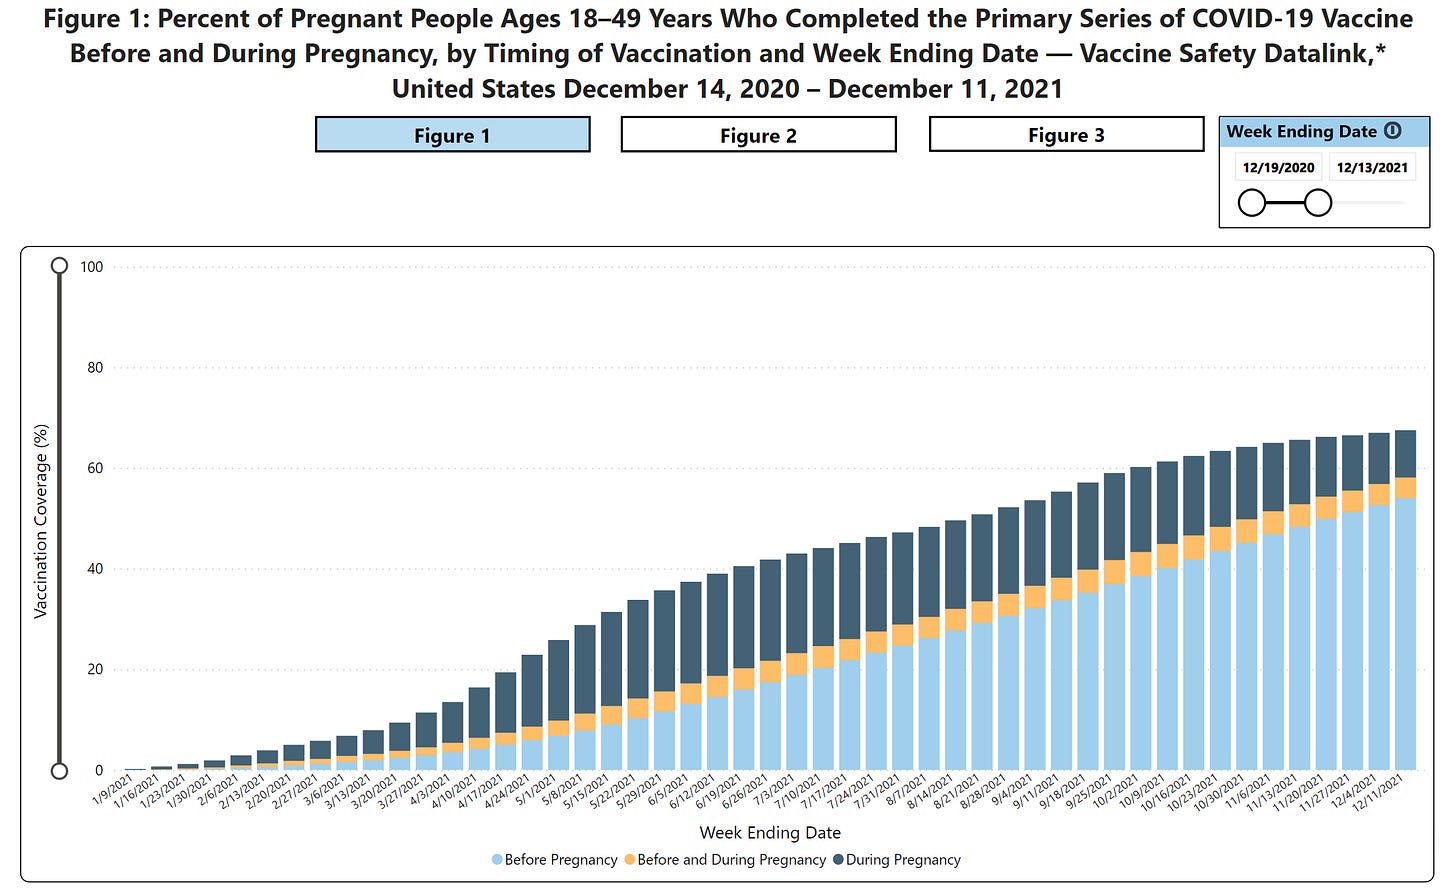
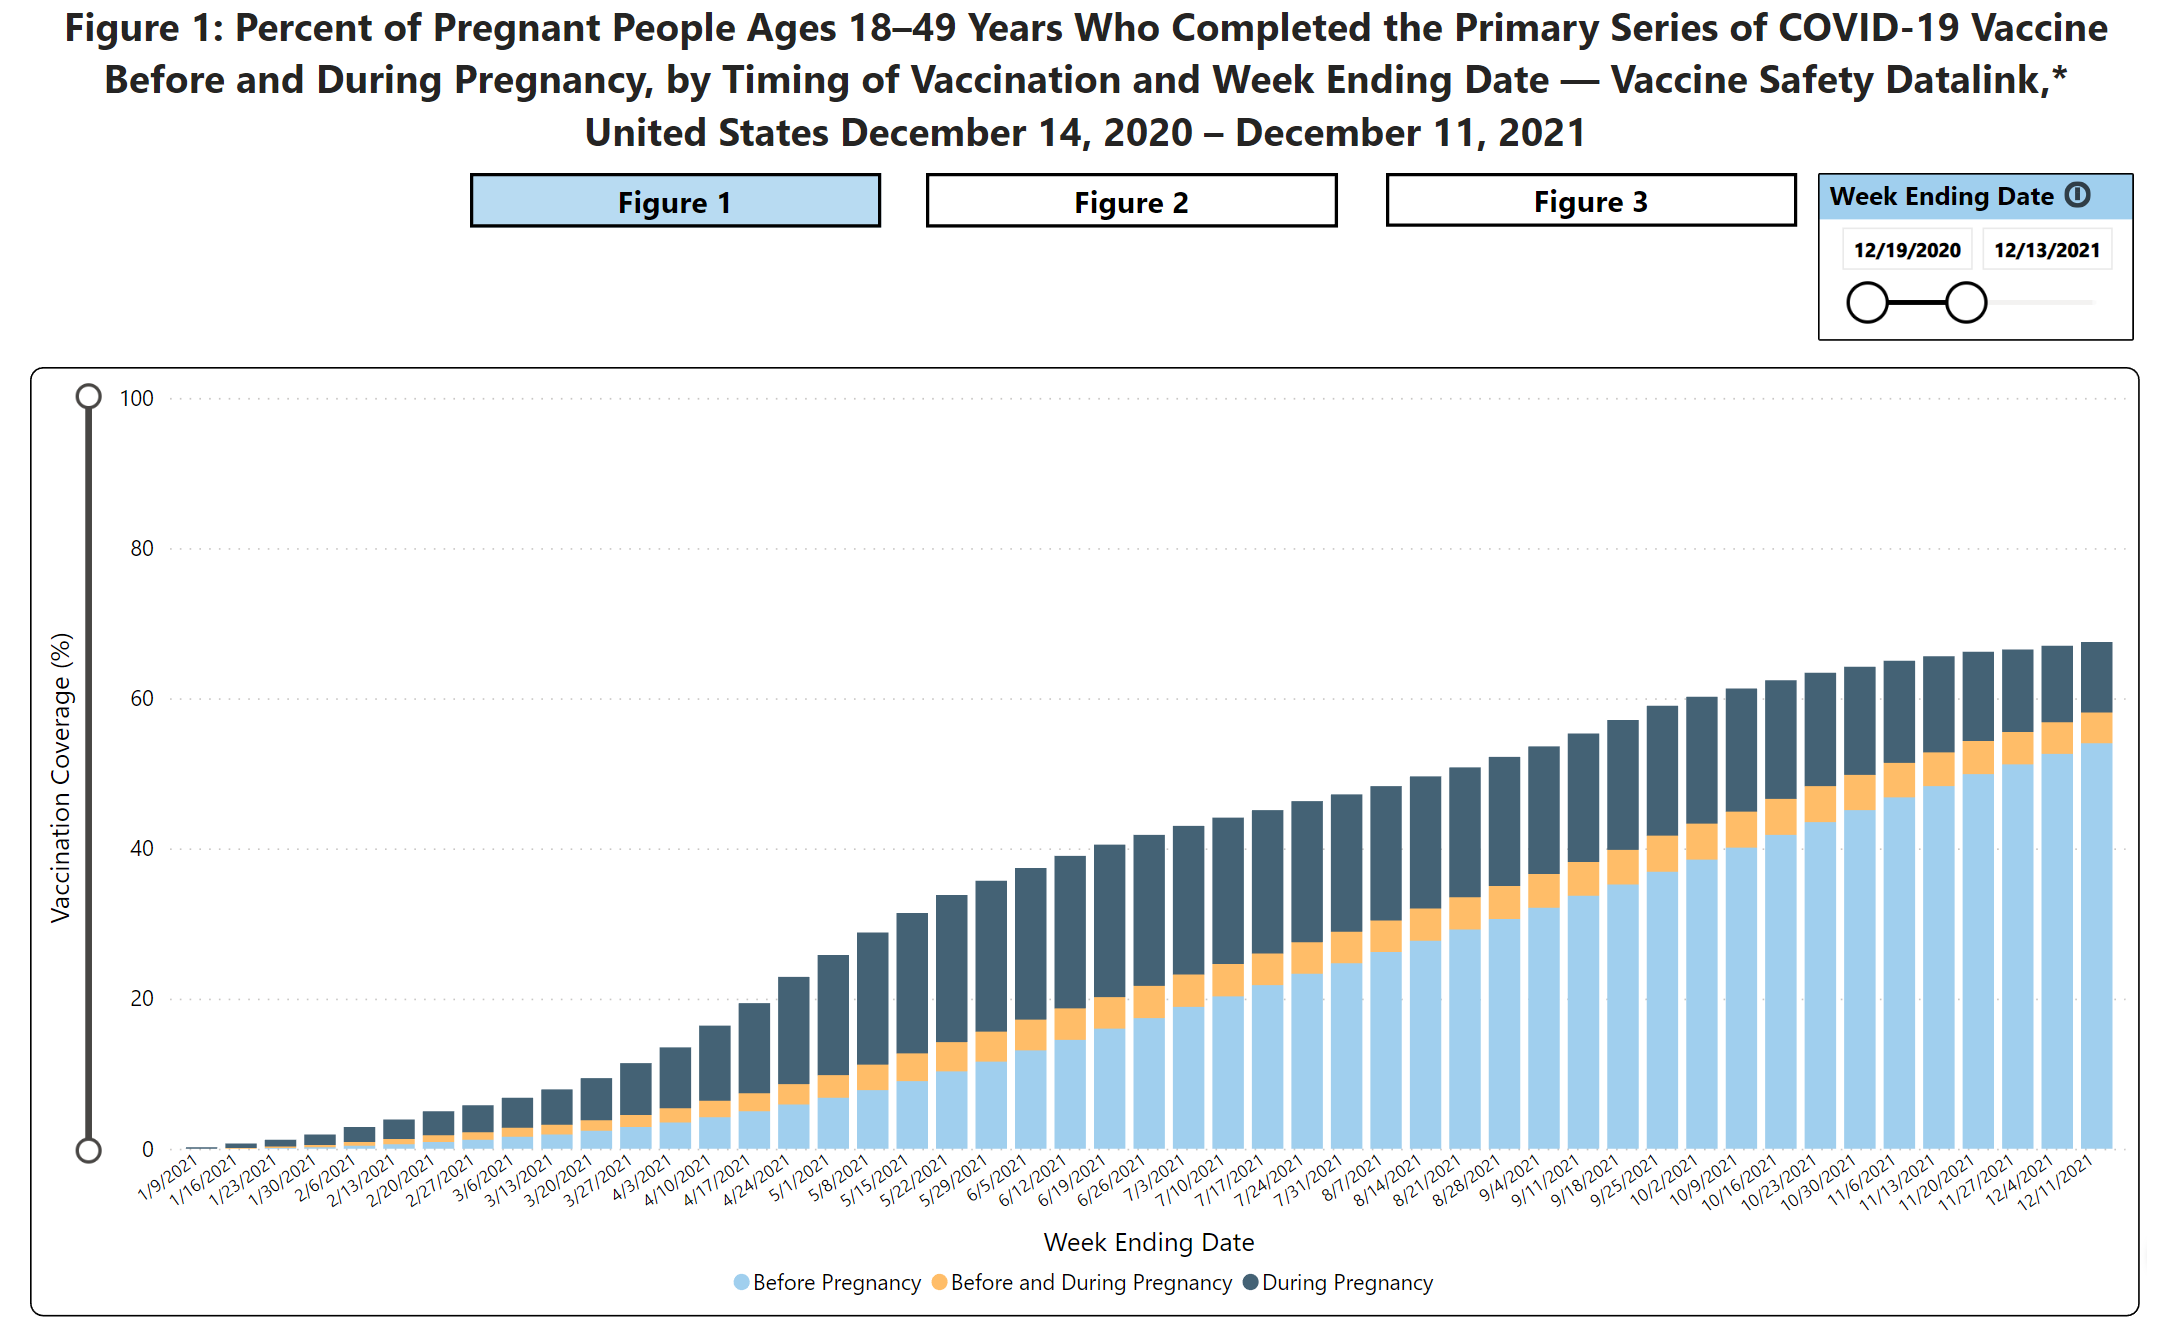
McCullough adds context: pregnant women were excluded from the randomized trials; roughly 3,000 pregnant American women — largely nurses — were vaccinated in the first week of the rollout, before mandates existed. ACOG still recommends vaccination at any point in pregnancy as of 2026. McCullough said peak vaccination rates for pregnant women hit 60% by the end of 2021
👶 Infant Mortality — The Nine-Month Lag
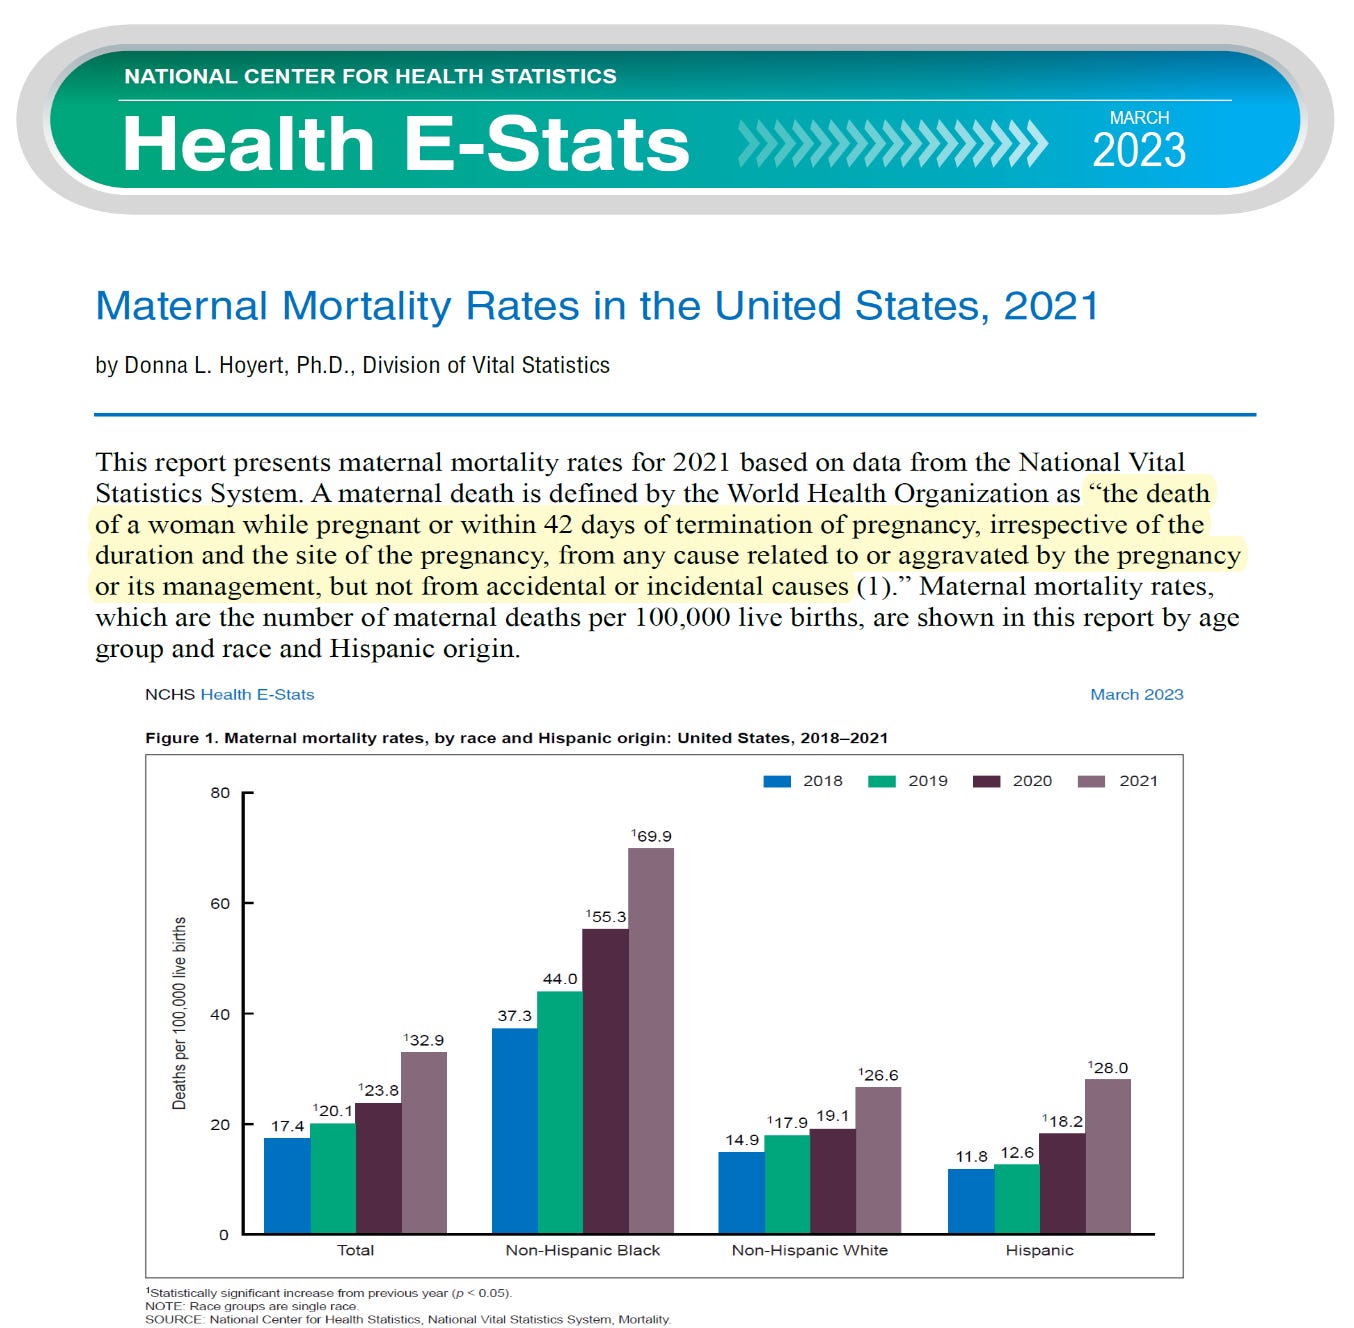
Hoyert et al, NCHS reported record maternal mortality in 2021, erasing roughly two decades of improvement; ~60% of pregnant women were vaccinated, but only 10% took the shots while gravid
Nine months after the August 2021 advisory — i.e., the first-trimester cohort coming to term — a stepwise increase in infant mortality appears in both male and female infants
The increase corresponds to roughly 4,000 excess infant deaths in the US versus the historic trend
All-cause infant deaths and ICD-10 P00–P96 deaths agree completely — the two curves overlap
Canada: same pattern following its own May 28, 2021 directive; ~200 excess infant deaths
Canada also saw ~27,000 excess induced abortions after the vaccination push — Rancourt speculates fear of fetal defects may have driven this
🧒 Toddlers and Preschoolers
US mortality for ages 1–4 shows a long, regular historic decline — then a sharp break
2021: first increase, coinciding with abrupt cuts to financial support in half the states
2022: the largest jump — the year vaccines were approved down to six months of age (June 17, 2022)
Roughly 2,000 excess toddler deaths in the US
Canada shows the same pattern across ages 1–4, 5–9, and 10–14 — with no financial-cut confounder — beginning in the year vaccines were approved for those groups and persisting afterward
🧬 Cancer Mortality
“Turbo cancer” is known in the literature as hyperprogressive disease, documented since ~2015 in connection with immune-therapy drugs — 300+ articles
In ages 5–44, a stepwise increase in all-cancer mortality corresponds to 4,000+ excess cancer deaths
In ages 5–24, 960 excess cancer deaths after vaccination — not in 2020 or 2021, but later, during mass vaccination of that group
Rare long-bone/limb cancers in ages 5–24 show a dramatic upshoot beginning in 2022
Multiple primary tumors (distinct primaries across different organs) in ages 75+ correspond to ~1,500 excess deaths
McCullough notes the current NCI director publicly denies any rise in cancer mortality — “I just showed proof that it has gone up significantly... from their own data”
🏥 Part Two: Societal Harm
P-score excess mortality by province tracks GDP per capita — economically active, wealthy provinces suffered most when economies were shut down
Hot spots of death worldwide are where poor people live near rich people (New York, London, Montreal’s core)
Excess mortality correlates with the fraction of large hospitals in a province
“Protecting the elderly” — lockdown and isolation intensity — was immediately followed by large mortality peaks in the 85+ group, then negative mortality afterward (a culling/dry-tinder effect). Rancourt: “It caused death.”
🧪 Mechanism: The Cationic Lipids
Rancourt singles out cationic lipid nanoparticles and their known toxicity as the limiting factor in their applications. McCullough notes VAERS recorded roughly 1,100 deaths the day of injection and 1,200 the next day in US data — consistent with acute lipid nanoparticle toxicity — while deaths years later show vaccine mRNA and spike protein as the cause of long pandemic syndromes.
🚨 The Call for Stratified Data
This is the crux, and both men press it hard:
The CDC and the Public Health Agency of Canada both hold mortality data and COVID-19 vaccination status data — separately
Neither merges them. Neither permits independent researchers to merge them.
Rancourt and colleagues, along with Steve Kirsch, have formally written for access. Denied.
Only one country is understood to have merged the datasets — the Czech Republic — and Rancourt notes “it’s not good news”
Without vaccination status on death records, the strongest possible analysis — all-cause mortality stratified by dose count (0, 1, 2, 3, 4+) — cannot be performed by anyone outside the agencies
McCullough’s framing: “Our National Cancer Institute and CDC will not do these analyses.” The counterfactual “lives saved” literature, Rancourt argues, is built on made-up counterfactuals — every one his team has audited has fallen apart under scrutiny.
🧭 Closing Arguments
Rancourt’s conclusion slide: “History is going to record that this COVID period was a massive, unnecessary, really avoidable assault against people.” Science never proves causality — but institutional capture can always invalidate screaming safety signals.
McCullough’s tactical advice: one point per paper. Get the maternal/fetal mortality paper out, two countries, one result. Rancourt counters that his reports and slides are published with DOIs at Correlation-Canada.org — data available to anyone, interpretation laid out, ready for others to carry into peer-reviewed journals.
The bottom line: the data exist, the signals are visible in hard mortality records, and the agencies that could settle the question in an afternoon by merging two databases they already own are refusing to do it — or to let anyone else do it.
📌 What the Research Would Look Like
If NIH and CDC (and PHAC) wanted to end the debate, they would:
Merge national mortality records with COVID-19 vaccination registries
Stratify all-cause mortality by dose count: 0, 1, 2, 3, 4+ doses
Break results out by age band, sex, pregnancy status, and time since last dose
Release the de-identified dataset to independent researchers for replication
Until that happens, Rancourt’s temporal-association analyses remain the most rigorous population-level work available — and the refusal to merge the data remains the most telling fact in the entire episode.
📝Please subscribe to FOCAL POINTS as a paying ($5 monthly) or founder member so we can continue to bring you the truth. AlterAI may be used to assist in searches, synthesis, and review.
Peter A. McCullough, MD, MPH
President, McCullough Foundation
FOCAL POINTS has partnered with AlterAI to support independent research and open inquiry. Subscribe to AlterAI today and get a discount on unbiased and accurate AI!

References
Rancourt, D. G. (2026, September 8). Video of Denis G Rancourt expert-witness testimony to the Allison Inquiry (8 September 2026) - Pregnancy, infant, toddler and accelerated cancer excess mortalities [Video recording]. Zenodo. Allison Inquiry, Ottawa, Canada. https://doi.org/10.5281/zenodo.22728061
Rancourt, D. G. (2026, September 8). Denis G Rancourt expert-witness presentation slides to the Allison Inquiry (8 September 2026) - Pregnancy, infant, toddler and accelerated cancer excess mortalities. Zenodo. Allison Inquiry, Ottawa, Canada. https://doi.org/10.5281/zenodo.22676709
https://correlation-canada.org/rancourt-expert-witness-presentation-to-the-allison-inquiry/


